
Building and Testing Your First Model

Part 5 of 5 — AI for Operations & Supply Chain
You have chosen your problem. You have written the problem statement. Your data passed the audit. The four roles are filled. Success criteria are set. The timeline clock is ticking.
Now it is time to actually build the model.
And here is the good news: the three steps involved are straightforward. They are not complicated. They involve no advanced math. What they do require is methodical attention to data quality, honest evaluation, and the willingness to revise your expectations based on what the results show.
The three steps
Every prediction model, regardless of how complex it looks, follows the same three-step process. This is true whether you are using a simple spreadsheet formula or the most advanced AI tool available. The difference is only in how much lifting the tool does for you. The logic is the same.
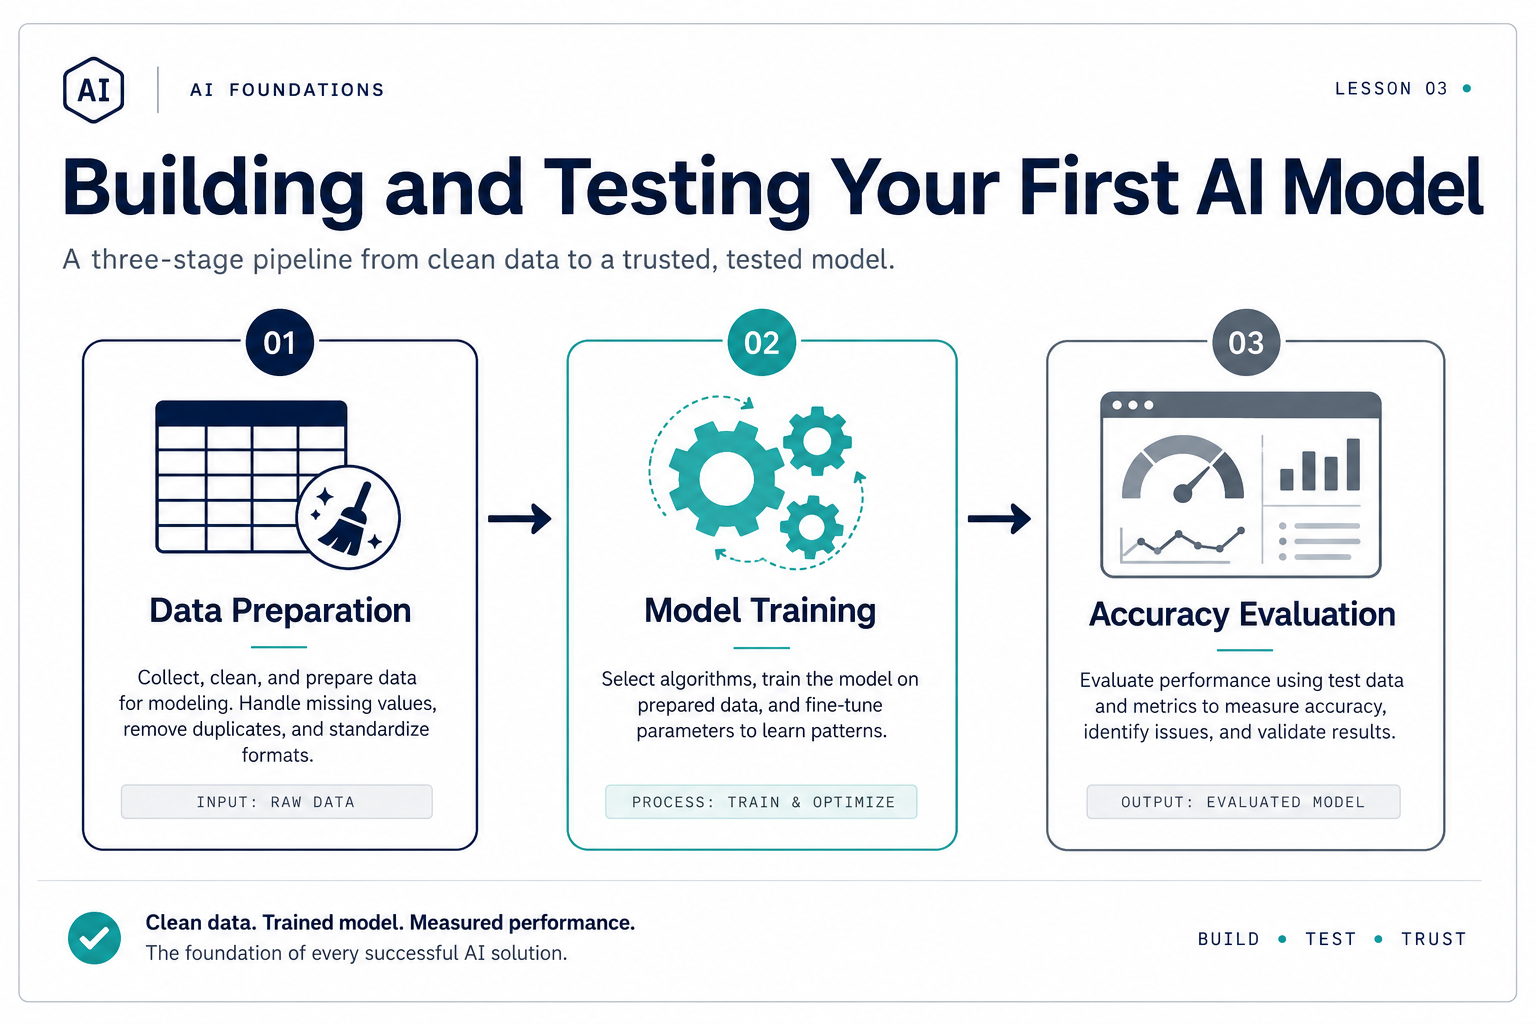
Step 1: Prepare the data. Gather the historical records the model will learn from. Clean up inconsistencies. Make sure every record has both the input information and the known outcome. This step takes more time than the rest of the process combined, and it has the largest impact on whether the model works.
Step 2: Train the model. Feed the prepared data to the system. Let it find patterns. The system produces a prediction model based on what it learned.
Step 3: Evaluate the results. Test the model on data it has never seen before. Compare its predictions to what actually happened. Measure against the success criteria you set in advance. Decide whether it is good enough to use.
Let us walk through each step with the delivery delay prediction example from lesson 4.
Step 1: preparing the data
This is where 80% of the effort lives, and it is also where most first-time builders rush through. Do not rush through. The quality of the model is bounded by the quality of the data it learns from. There is no shortcut around this.
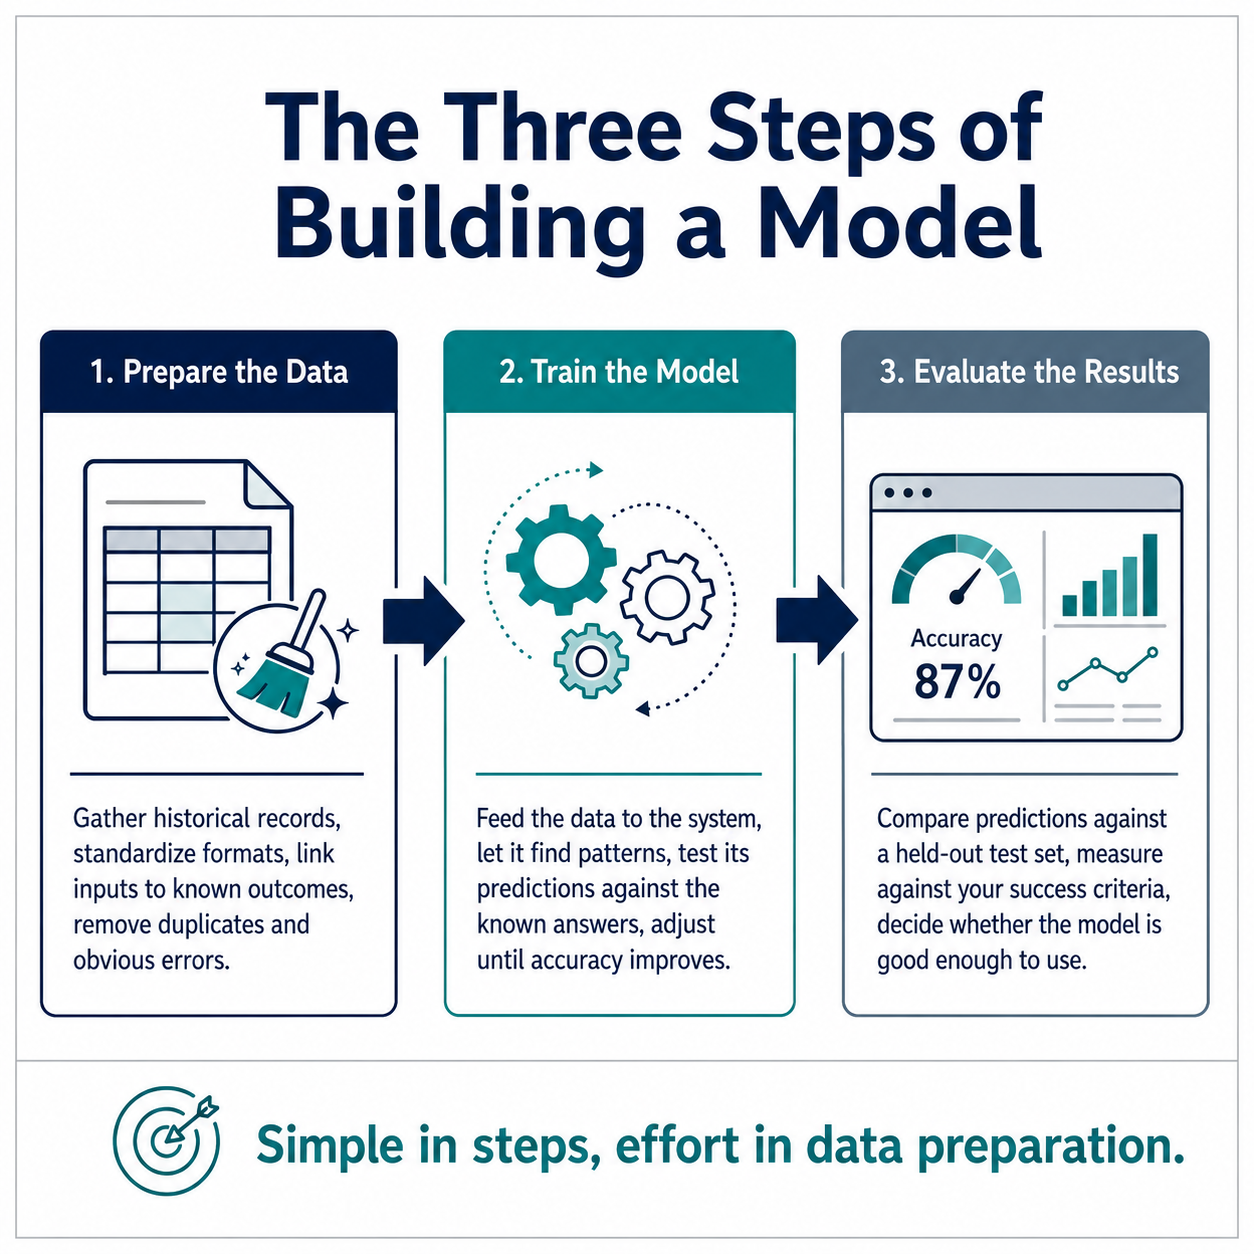
Start by pulling the raw historical data. For a delivery delay prediction, that means every PO from the past 12 to 18 months with supplier name, PO date, order quantity, material type, promised delivery date, and actual delivery date.
Then clean it up. Here are the most common problems and how to fix them:
Duplicate records. If the same PO appears twice because it was updated, keep the version with the actual delivery date. Duplicates confuse the model by giving some suppliers more weight than they deserve.
Inconsistent supplier names. "Matsui Heavy Industries," "M. Matsui Co," and "Matsui-HI" are the same supplier. Consolidate them to a single name. The model treats each variant as a different supplier otherwise, which means it cannot learn Matsui's actual reliability pattern.
Date format mismatches. If some dates are in MM/DD/YYYY and others in YYYY-MM-DD, standardize. If promised delivery dates are in the ERP but actual delivery dates are in email threads, you need to get them into one system. The model needs both dates to calculate the variance.
Missing outcomes. If some POs have no actual delivery date because they are still open, remove them from the training set. The model learns from completed events, not pending ones. The pending POs are exactly what you will predict on later.
Calculating the target. The model needs a clear yes/no outcome. Create a column that says "Late" or "On Time" based on the actual delivery date versus the promised delivery date. Define the threshold: is two days late considered late? Five days? Use the threshold that matters to the business, not the threshold that is easiest to measure.
Once the data is clean, you need to decide which columns the model uses as inputs. These are called features.
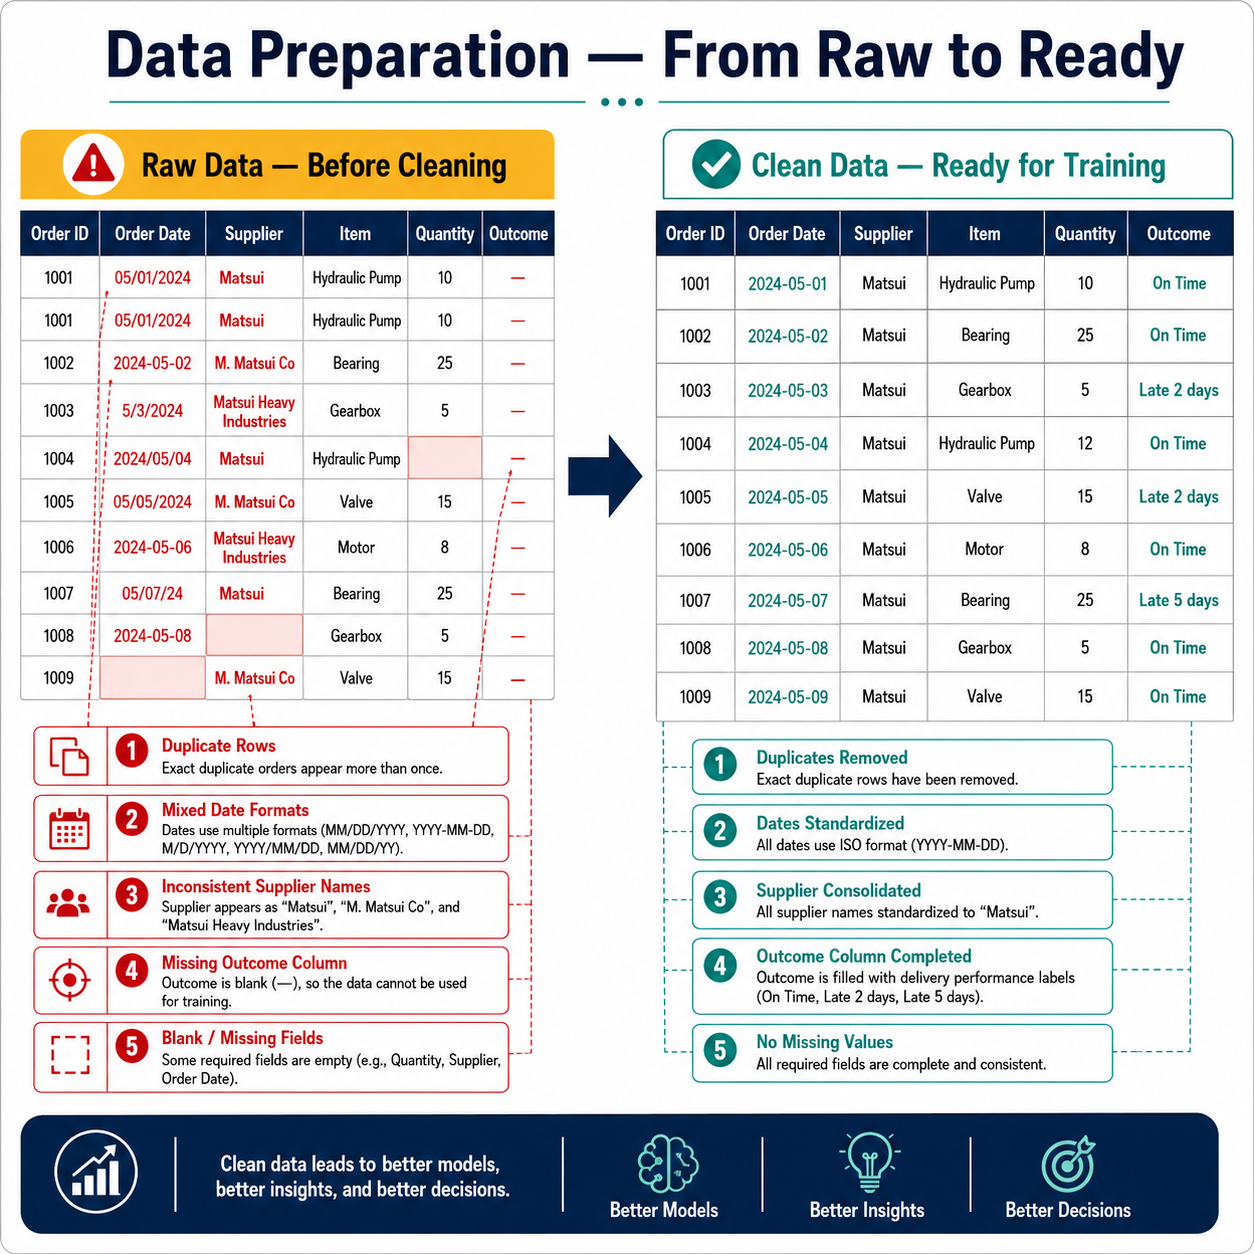
Features are the pieces of information available at prediction time. That qualifier matters. If you know the supplier name, the order quantity, and the time of year when you place a PO, those are valid features. If you only know the actual delivery date after the delivery happens, that is not a valid feature for prediction. It is the outcome.
Using information that is not available at prediction time is called data leakage. It is the most common mistake first-time builders make. The model looks spectacularly accurate in testing, because it was given information it would not have in the real world. Then it performs terribly in production, because the leaked information is no longer available.
The simple test: when you predict delivery delay for PO-99001 this morning, do you have this information right now? If yes, it is a valid feature. If you would only know it after the delivery, it is not.
Step 2: training the model
Training is what most people imagine when they hear "AI." And the reality is simpler than the imagination. You give the system clean historical data with known outcomes. It finds patterns. It produces a prediction model.
The technical details vary depending on the tool you use. But the concept is universal: the system examines every record in the training set, looks for relationships between features and outcomes, and builds an internal model that captures those relationships.
For example, it might discover that orders from supplier X during October have a 42% delay rate, compared to an overall average of 15%. It might find that orders over 5,000 units are 2.3 times more likely to be late than smaller orders. It might detect that POs placed within 14 days of a Chinese national holiday have a higher delay rate, but only for suppliers with manufacturing in Southeast Asia.
You do not need to know these relationships in advance. The model finds them. Your job is to give it good data and to evaluate whether what it found is useful.
Step 3: evaluating the results
This is the step that separates honest builders from hopeful ones. The model looks great on the data it trained on. Of course it does. It studied those records. The real test is how it performs on data it has never seen.
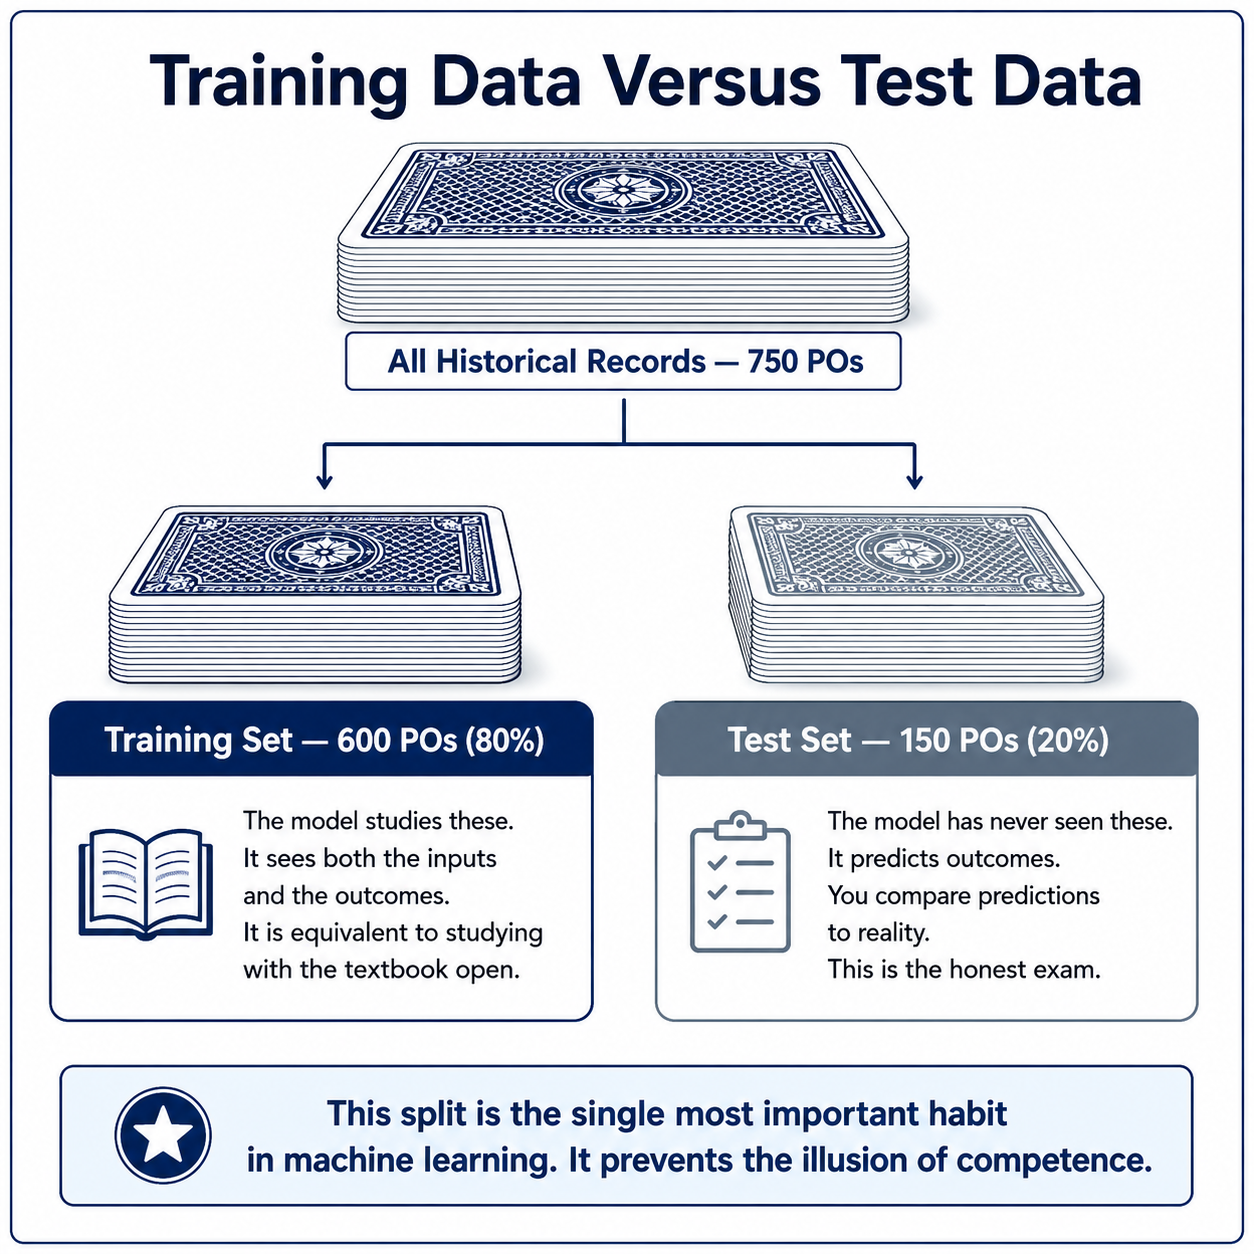
That is why you split your data before training. The standard split is 80% for training, 20% for testing. The model never sees the test set. Not during training, not during tuning, not at any point before the evaluation.
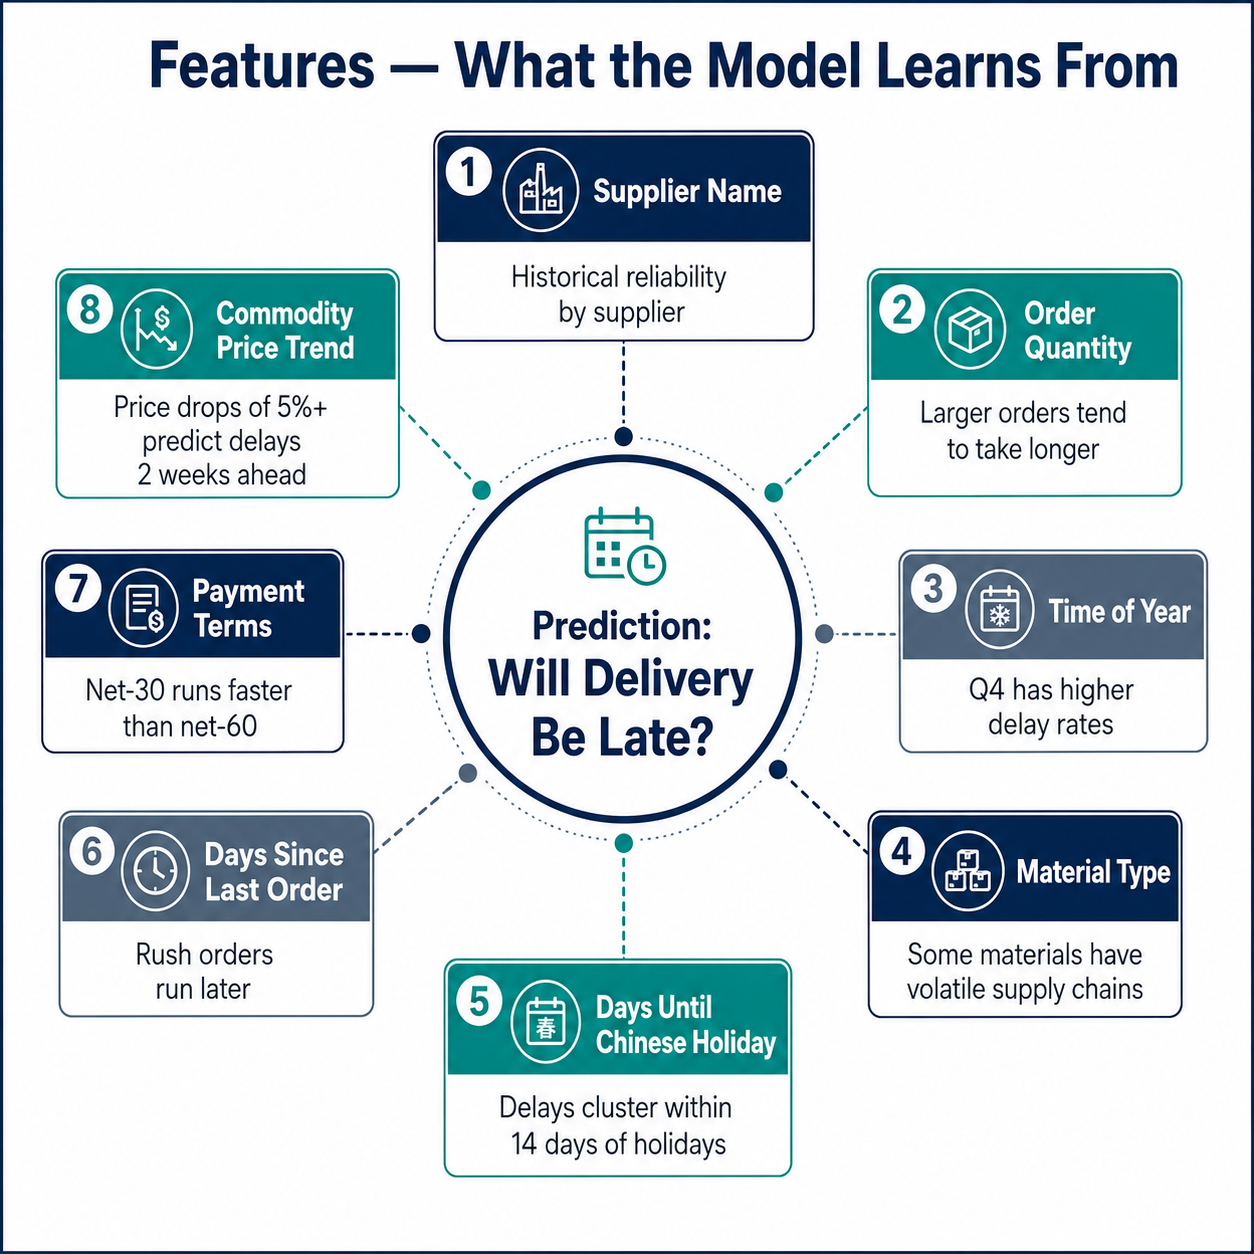
When the evaluation arrives, you give the test set inputs to the model and let it predict. You compare every prediction to the actual outcome. And you measure three things.
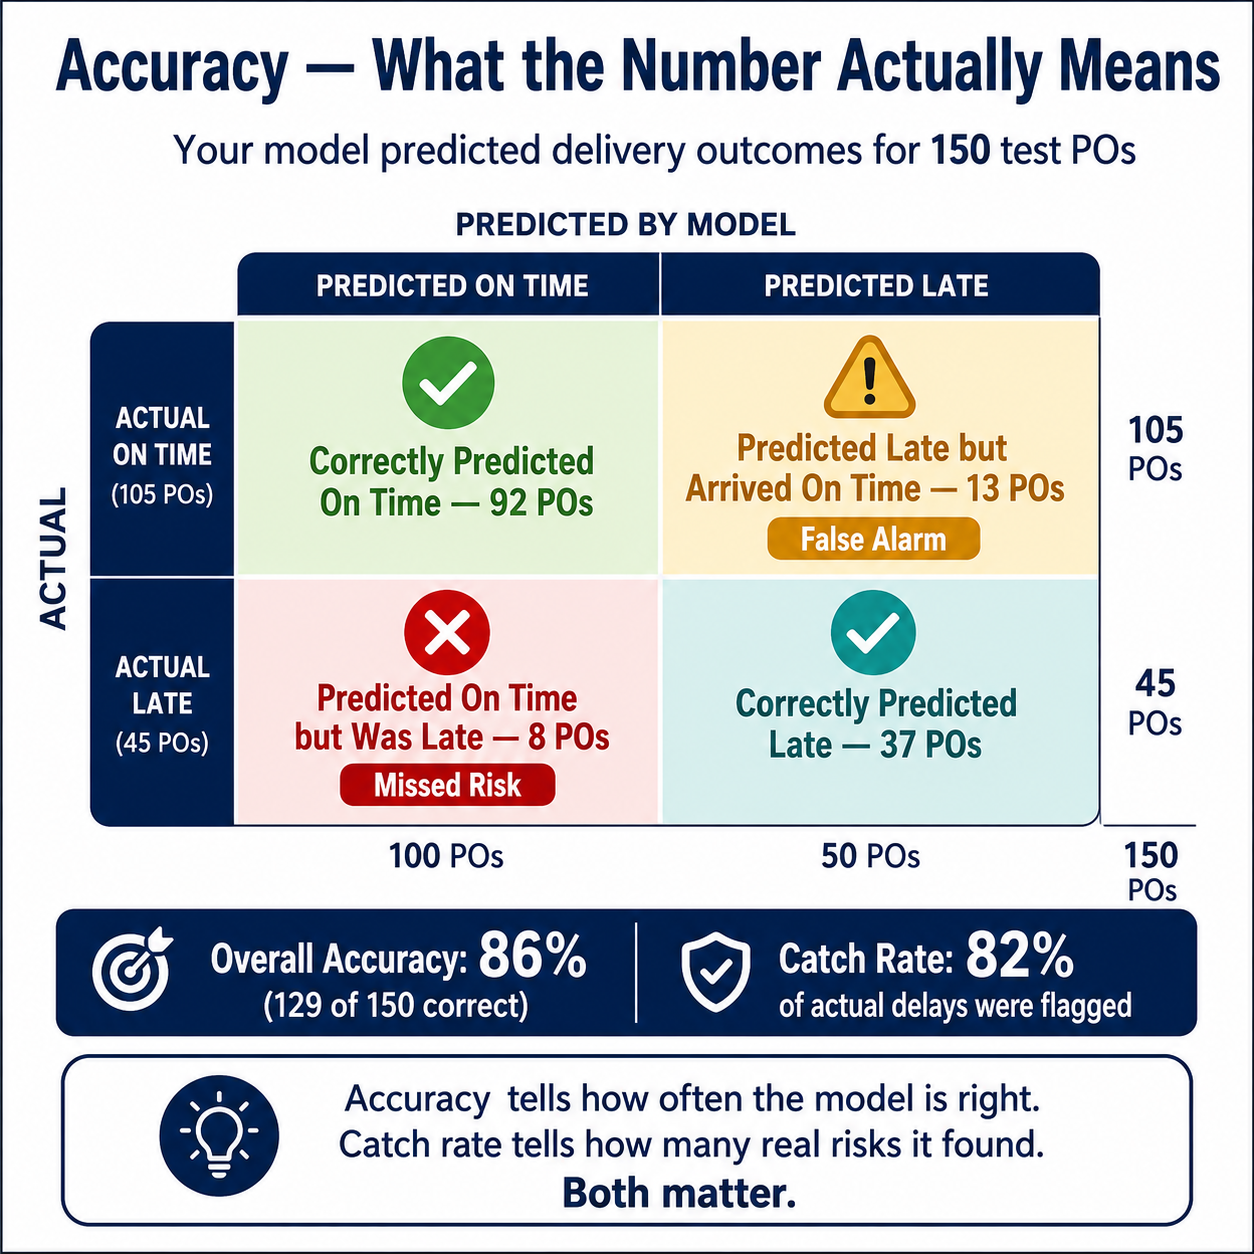
Overall accuracy. What percentage of predictions match reality? If the model predicted correctly on 129 of 150 test POs, overall accuracy is 86%.
The catch rate. Of the POs that were actually late, how many did the model flag? If 45 of the test POs were late, and the model predicted 37 of them would be late, the catch rate is 82%. This matters more than overall accuracy, because the cost of missing a real delay is usually much higher than the cost of a false alarm.
The false alarm rate. Of the POs the model flagged as late, how many actually arrived on time? If the model flagged 50 POs as late, and 37 were actually late, 13 were false alarms. That means about 26% of the flags were wrong. The planner will need to act on those 13 POs and find nothing wrong. That is the cost of the prediction system: 13 extra reviews per batch.
These three numbers tell the story. Overall accuracy gives the headline. The catch rate tells how many real risks the model found. The false alarm rate tells how much extra work the system creates for the team.
None of these numbers is perfect on its own. A model that flags every PO as "late" has a 100% catch rate and zero misses. But it is useless, because the planner cannot act on 100% of POs. A model that flags nothing is perfectly accurate on the POs it does not flag, but it catches zero risks. Both extremes are wrong.
Compare the numbers against the success criteria you set in lesson 4. Not aspirational criteria. The ones you agreed to before the project started.
Is the accuracy good enough?
This is the judgment call. And it is the one where teams need honest discipline.
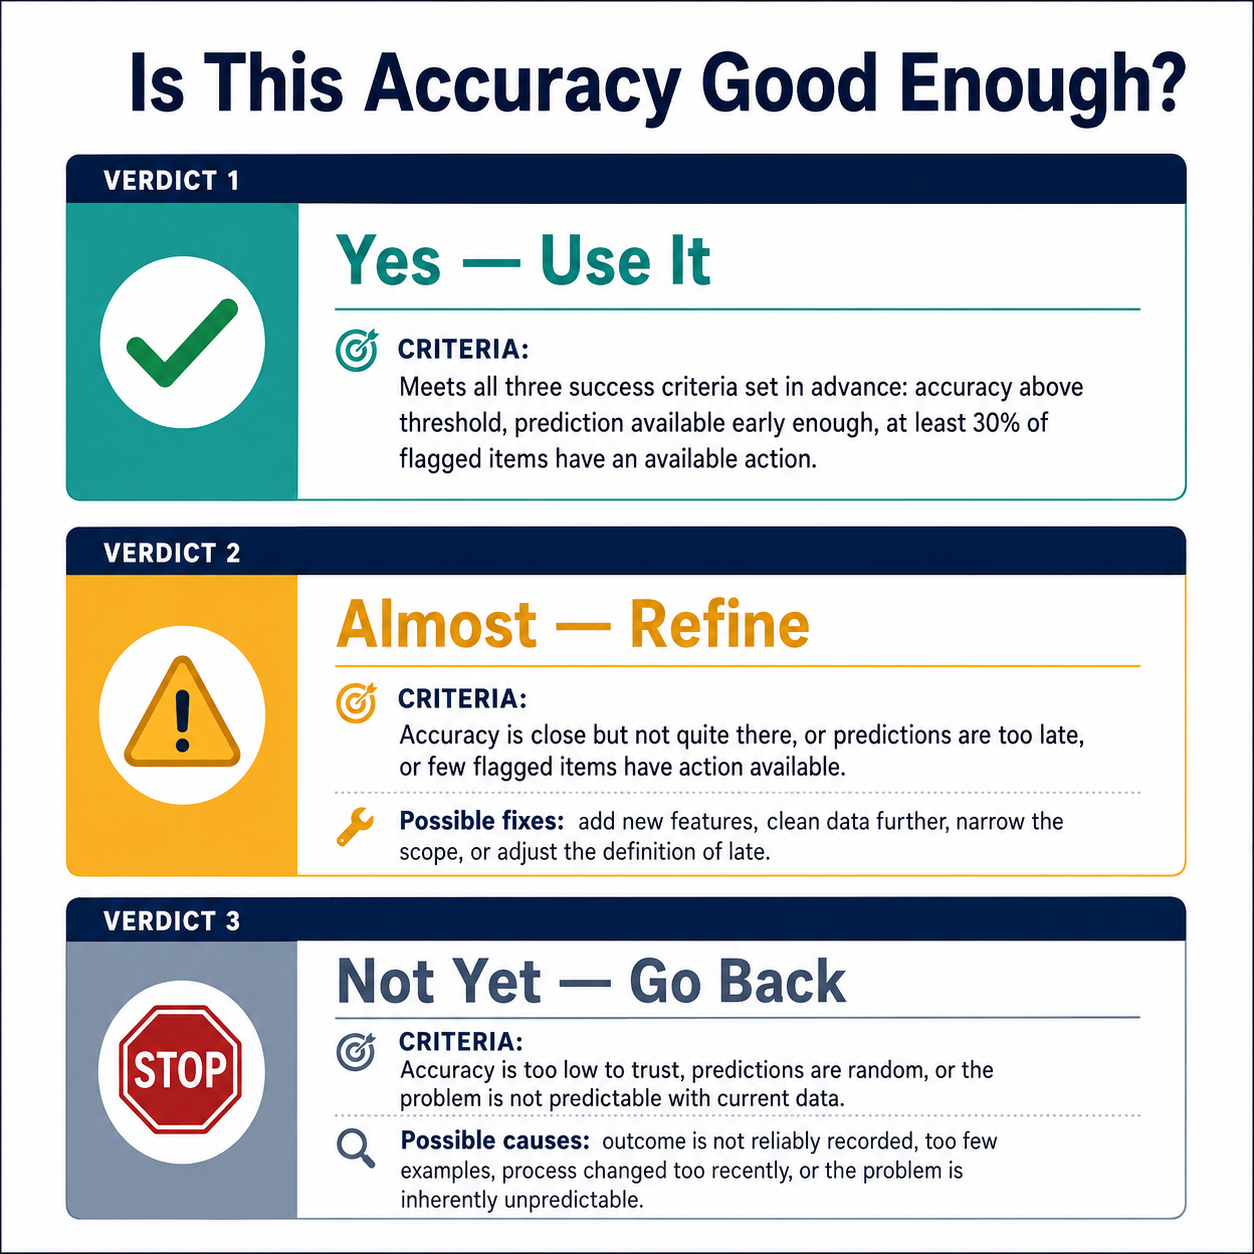
Yes, use it. The model meets or exceeds all three success criteria. Accuracy is above the agreed threshold. Predictions are available early enough to enable action. A meaningful percentage of flagged items have available responses. This is a win. Deploy it in pilot mode and track real-world performance.
Almost, refine it. One or two criteria are close but not met. Accuracy is within a few percentage points. Or predictions are accurate but arrive too late. Or the catch rate is high but the false alarm rate creates too much work. This is not failure. It is a signal to iterate. Add a relevant feature. Clean the data further. Narrow the scope to the subset where the model performs best.
Not yet, go back. Accuracy is too low. The model performs near random. Or the catch rate is so poor that it misses most real risks. This is the hardest verdict, but it is the most honest one. The problem is not that AI does not work. It is that the current data cannot support this prediction. The fix is usually one of three things: more historical data, better outcome recording, or a different problem that the data is better suited to.
Resist the temptation to deploy a model that does not meet the success criteria. You might convince yourself that "85% is good enough." The planner will not. Every wrong prediction erodes trust. And once trust is broken, rebuilding it takes longer than building the model did.
Five common first-time mistakes
Every team that builds its first model makes mistakes. These are the ones that cost the most time.
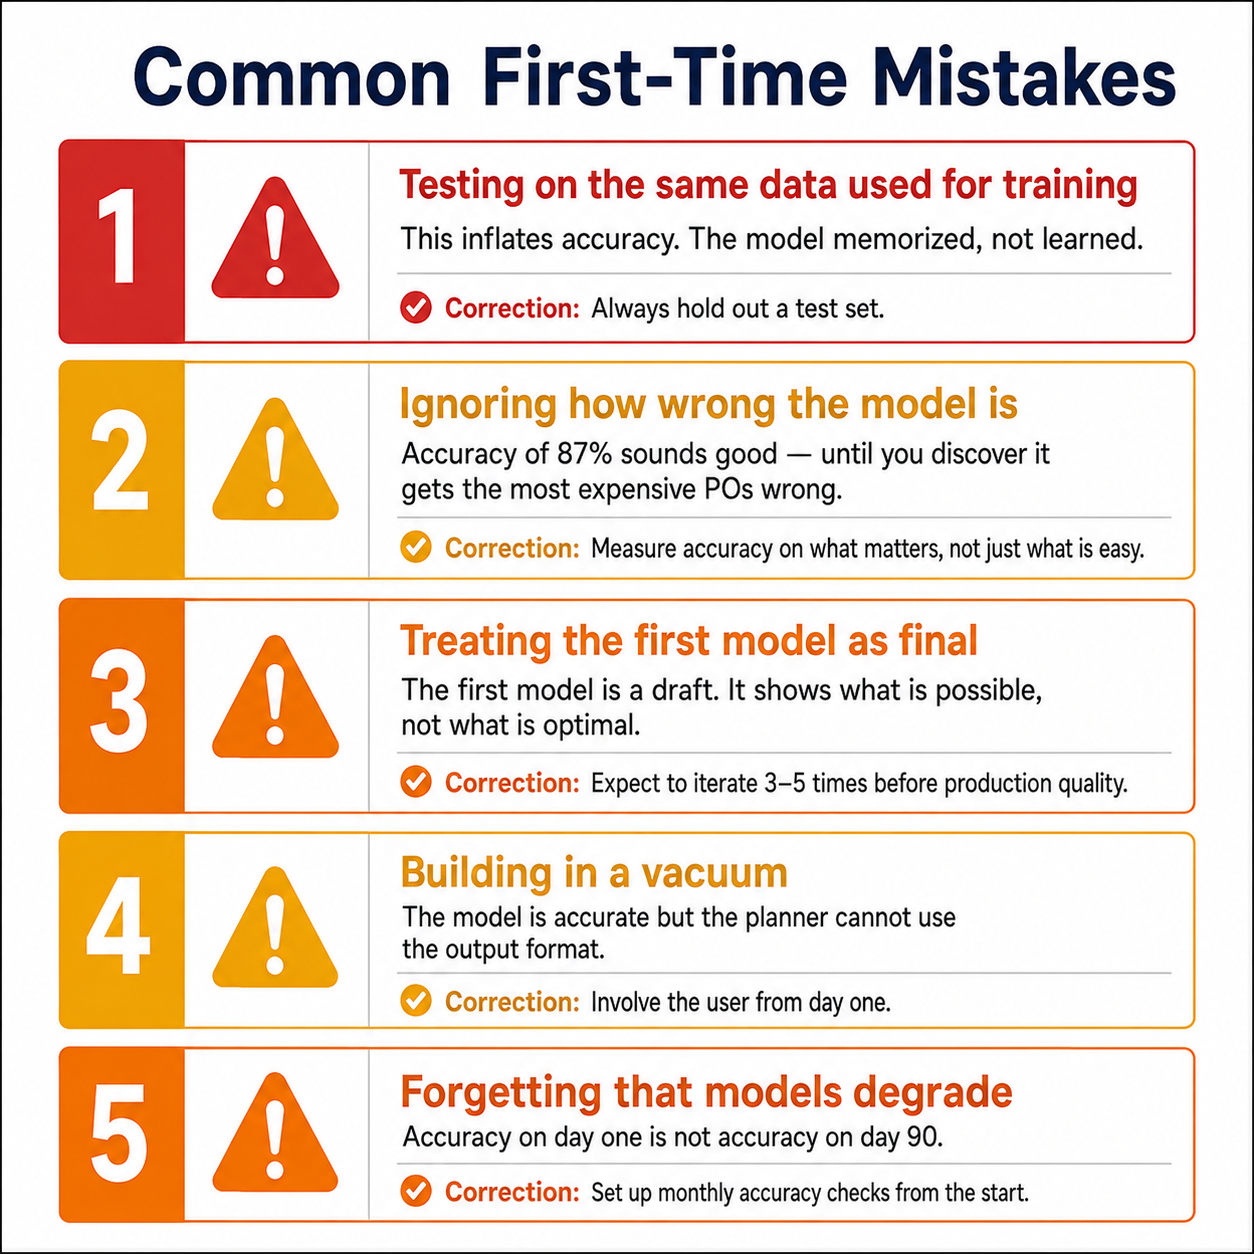
Testing on training data. This produces inflated accuracy. The model memorized the answers instead of learning patterns. It is equivalent to a student studying from the exact exam questions. Always hold out a test set.
Ignoring how wrong the model is. "87% accuracy" sounds good, until you discover the model consistently gets the most expensive POs wrong. The 13% it misses might account for 60% of the dollar value. Measure accuracy on what matters, not just what is easiest to count.
Treating the first model as final. The first model is a draft. It uses whatever data you have, whatever features you identified, and whatever choices you made on the first pass. It is a baseline, not a finished product. Expect to iterate three to five times before you reach production quality.
Building without the user. The model is 92% accurate but outputs predictions in a format the planner cannot use. Or it flags POs three hours before delivery, which is too late to arrange coverage. Technical accuracy means nothing if the output does not fit the user's workflow. Involve the user from day one. Show them the output. Ask whether they can act on it.
Forgetting that models degrade. Accuracy on day one is not accuracy on day 90. The world changes. Suppliers change. Products change. Processes change. A model trained on last year's data gradually becomes less accurate as conditions shift. Set up monthly accuracy checks from the start. When performance drops below the threshold, retrain on fresher data.
The iteration cycle
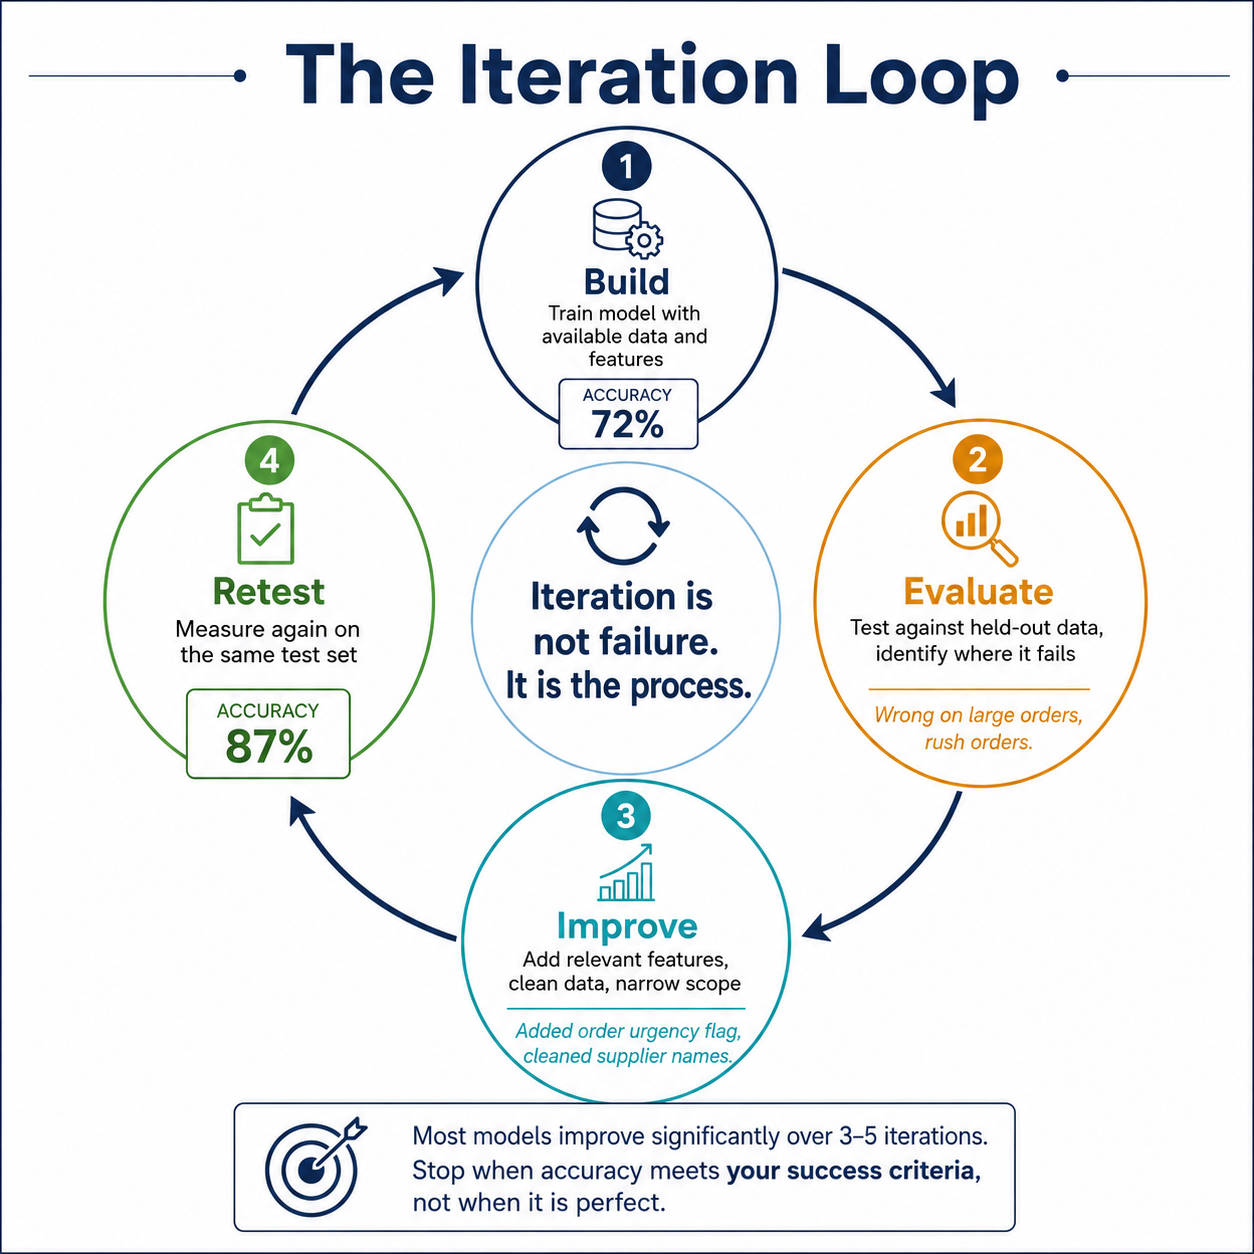
Iteration is not failure. It is the normal process of improving a model. The first version establishes a baseline. Each cycle improves it by addressing specific weaknesses found during evaluation.
Here is what a typical iteration cycle looks like.
The first model predicts delivery delay at 72% accuracy. The evaluation reveals it performs well on standard orders but poorly on large orders and rush orders. The improvement: add an "order urgency" flag as a feature, consolidate supplier names that were inconsistent, and clean up the material type codes. The second model runs at 81%. The evaluation shows it is still missing delays caused by material shortages. The improvement: add a commodity price trend feature that captures whether prices dropped in the prior 30 days. The third model hits 87%.
At 87%, the model meets the 85% accuracy threshold set in advance. The catch rate is 82%. The false alarm rate is 26%, which means 74% of flagged POs are genuinely at risk. The team decides this is good enough for a pilot.
The model did not get there in one shot. It took three iterations. Each iteration was informed by the specific weaknesses of the previous version. That is how model building works.
And here is the principle that governs when to stop iterating: stop when the model meets your success criteria. Not when it reaches 99% accuracy. Not when it is perfect. The cost of chasing the last few percentage points of accuracy usually exceeds the business value they provide. Good enough, deployed and used, is better than perfect, sitting in development.
Key takeaways
- Building a model has three steps: prepare the data, train the model, evaluate the results. Data preparation takes most of the time and has the largest impact on quality.
- Only use features that are available at prediction time. Information you would only know after the fact is data leakage, not a valid feature.
- Split your data before training: 80% for training, 20% for testing. Never evaluate a model on the data it trained on.
- Measure three evaluation metrics: overall accuracy (how often the model is right), catch rate (how many real risks it found), and false alarm rate (how many flagged items turned out fine).
- Compare results against success criteria set in advance. If the model meets them, deploy in pilot mode. If it is close, iterate. If it falls short, reconsider the problem or the data.
- The first model is a draft, not a finished product. Expect three to five iterations. Stop when accuracy meets your criteria, not when it is perfect.
- Models degrade over time as conditions change. Set up monthly accuracy checks from day one.
Next lesson: Deploying the model in production and keeping it accurate over time.